67,000 Structures. Ten Years. One State.
California averaged 8,000+ wildfires per year from 2015 to 2025. The fires are getting closer to where people live. Here is what the data looks like.
The Numbers at a Glance
4.2M
Acres 2020
Worst year on record. More than 10,000 structures destroyed.
18,804
Camp Fire
Structures destroyed in Butte County, 2018. Deadliest fire in state history.
16,829
Jan 2025
Structures lost in the Palisades and Eaton fires in just four months.
100%
Sprinklers
Survival rate for homes with exterior sprinklers at Ham Lake Fire (188 of 188).
California Wildfires by Year
The numbers tell the story. Some years are quieter. Others are catastrophic. But the trend is clear: California's fire seasons are getting longer, and the fires are getting closer to where people live.
| Year | Fires | Acres Burned | Structures |
|---|---|---|---|
| 2025 (Jan-Apr) | 1,234 | 42,488 | 16,829 |
| 2024 | 7,627 | 1,024,502 | 2,326 |
| 2023 | 6,643 | 321,000 | 245 |
| 2022 | 7,490 | 362,455 | 772 |
| 2021 | 8,835 | 2,569,009 | 3,629 |
| 2020 | 9,917 | 4,257,863 | 10,488 |
| 2019 | 7,860 | 253,321 | 732 |
| 2018 | 7,948 | 1,893,913 | 24,226 |
| 2017 | 9,133 | 1,548,429 | 10,280 |
| 2016 | 6,954 | 564,477 | 1,274 |
| 2015 | 8,283 | 880,899 | 2,854 |
Source: CAL FIRE annual reports and NIFC statistics. 2025 data is partial (January through April).
Look at 2020. Over four million acres and 10,000 structures gone. That was during a pandemic, when fire crews were already stretched thin. Then 2018, where 100 people died and 24,000 structures were destroyed in a single season. These are not outliers anymore. They are the new normal.
Most Destructive California Wildfires
Ranked by structures destroyed. Six of the top ten happened in the last eight years.
| # | Fire Name | Year | County | Structures |
|---|---|---|---|---|
| 1 | Camp Fire | 2018 | Butte | 18,804 |
| 2 | Palisades Fire | 2025 | Los Angeles | 12,401 |
| 3 | Tubbs Fire | 2017 | Sonoma/Napa | 5,636 |
| 4 | Eaton Fire | 2025 | Los Angeles | 4,428 |
| 5 | Tunnel/Oakland Hills Fire | 1991 | Alameda | 2,900 |
| 6 | Cedar Fire | 2003 | San Diego | 2,820 |
| 7 | Valley Fire | 2015 | Lake | 1,955 |
| 8 | Witch Fire | 2007 | San Diego | 1,650 |
| 9 | Woolsey Fire | 2018 | Los Angeles/Ventura | 1,643 |
| 10 | Thomas Fire | 2017 | Ventura/Santa Barbara | 1,063 |
Source: CAL FIRE Top 20 Most Destructive California Wildfires. Structure counts include residences and commercial buildings.
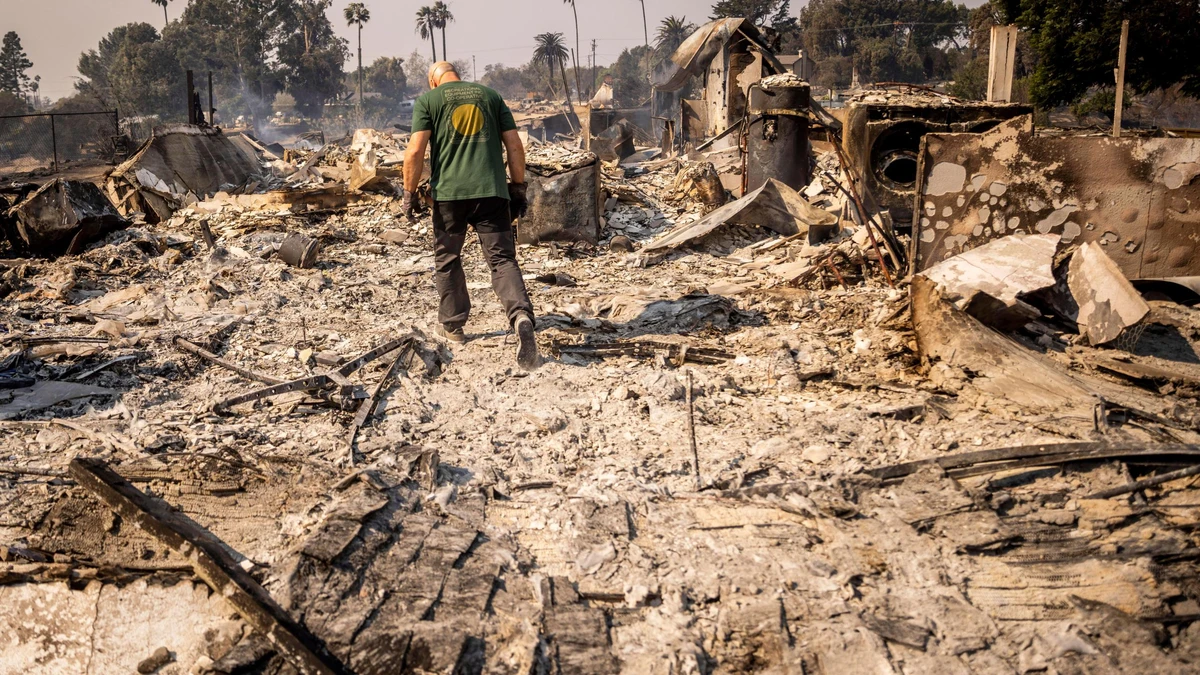
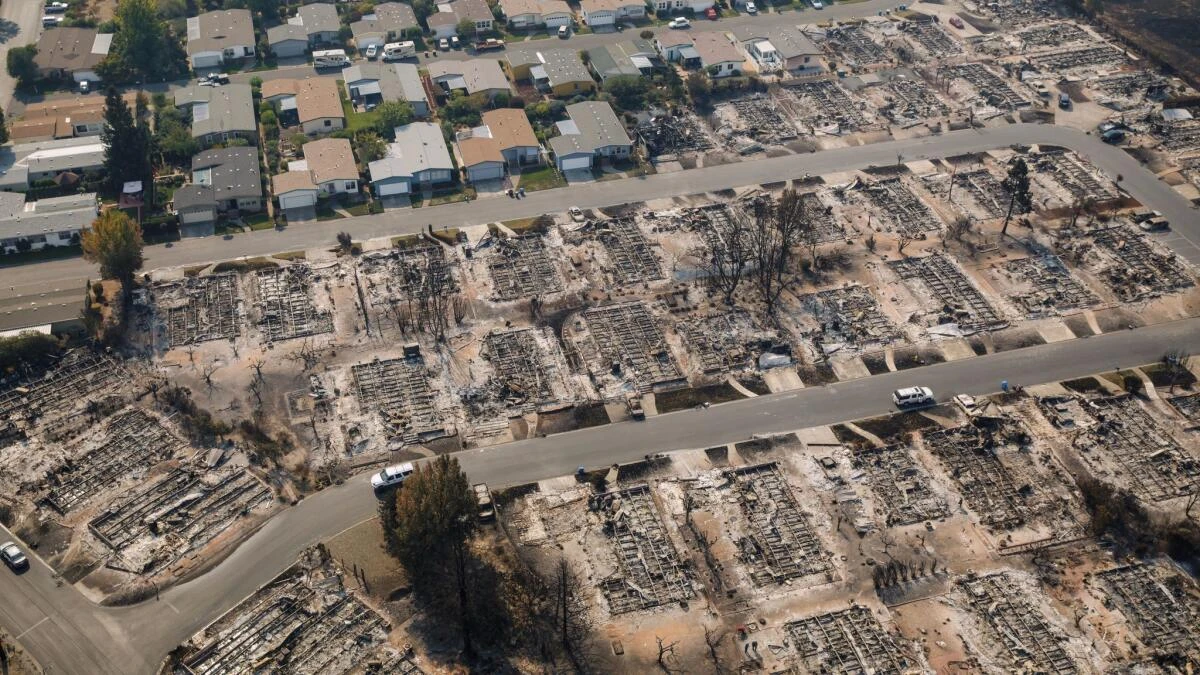
Entire neighborhoods reduced to foundations. For many families, everything was gone in under an hour.
The Camp Fire killed 85 people in Paradise in 2018. It remains the deadliest California wildfire in modern history. But the 2025 Palisades and Eaton fires in Los Angeles are already the second and fourth most destructive by structures lost. These fires hit some of the most expensive real estate in the country, and the rebuilding costs will run into the tens of billions.
Bay Area Wildfire History
People sometimes think of the Bay Area as an urban region that does not have serious wildfire risk. The history says otherwise. Our team works in these communities every day, and we see how the topography, vegetation, and building density create conditions that are genuinely dangerous.
Oakland Hills Tunnel Fire (1991)
2,900 structures destroyed. 25 fatalities. 1,600 acres burned in just a few hours. Rebuilding costs exceeded $1.5 billion in 1991 dollars. This fire reshaped California building codes and remains the most destructive fire in Bay Area history.
Tubbs Fire (2017)
5,636 structures destroyed across Sonoma and Napa counties. 22 fatalities. Entire neighborhoods in Santa Rosa were leveled, including Coffey Park and Fountaingrove. The fire moved so fast that some residents had less than 15 minutes to evacuate.
CZU Lightning Complex (2020)
1,490 structures destroyed in Santa Cruz and San Mateo counties. One fatality. 86,509 acres burned through old-growth redwood forests and rural communities. Over 77,000 residents were under evacuation orders.
Glass Fire (2020)
1,555 structures destroyed in Napa and Sonoma counties. Zero fatalities, but several wineries and luxury homes valued at $5M to $15M were lost. Rebuild costs in the area ran $500 to $1,500 per square foot.
Kincade Fire (2019)
374 structures destroyed in Sonoma County. 77,758 acres burned. Nearly 190,000 people were evacuated, the largest evacuation in Sonoma County history. Caused by a PG&E transmission line failure.
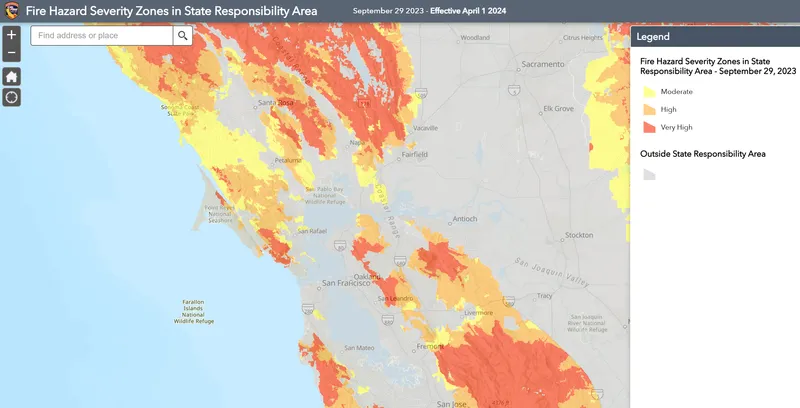
Fire Hazard Severity Zone map of the Bay Area. Red and orange zones indicate high and very high wildfire risk.
If you live in the Oakland or Berkeley Hills, anywhere along the Highway 24 corridor, the hills above Saratoga or Los Gatos, or the rural edges of Sonoma and Napa counties, you are in a high-risk zone. Our founders grew up working in construction and landscaping in these exact communities, and the fire risk is something we see firsthand every single day.
The Insurance Crisis Behind the Numbers
The fires themselves are only part of the story. What happens after the fire is often just as devastating for homeowners, especially when it comes to insurance.
257,014
homeowner policies non-renewed in California from 2020 to 2023
642,000+
FAIR Plan policies active statewide, up 165% since 2019
$3M
maximum FAIR Plan dwelling coverage, often far below Bay Area rebuild costs
2,628%
FAIR Plan growth in one Orinda ZIP code alone from 2015 to 2023
What This Means for Bay Area Homeowners
If your carrier drops you, the FAIR Plan becomes your insurer of last resort. But the FAIR Plan caps dwelling coverage at $3 million. In much of the Bay Area, rebuild costs for a single-family home run $500 to $1,500 per square foot depending on location, slope, access, and finish level. A 3,000-square-foot home in the Oakland Hills or Saratoga Hills could easily cost $4 million to $6 million to rebuild. That means a coverage gap of $1 million or more, even with the FAIR Plan.
The good news is that California's Safer from Wildfires framework (Regulation 2644.9) now gives homeowners a path forward. When you complete the 12 mitigation categories, which cover everything from roofing materials to defensible space to ember-resistant vents, you build a documented case for insurance discounts. You may qualify for reduced FAIR Plan premiums, have a stronger case for exiting the FAIR Plan, and become more attractive to standard carriers who are re-entering the California market under new regulations.
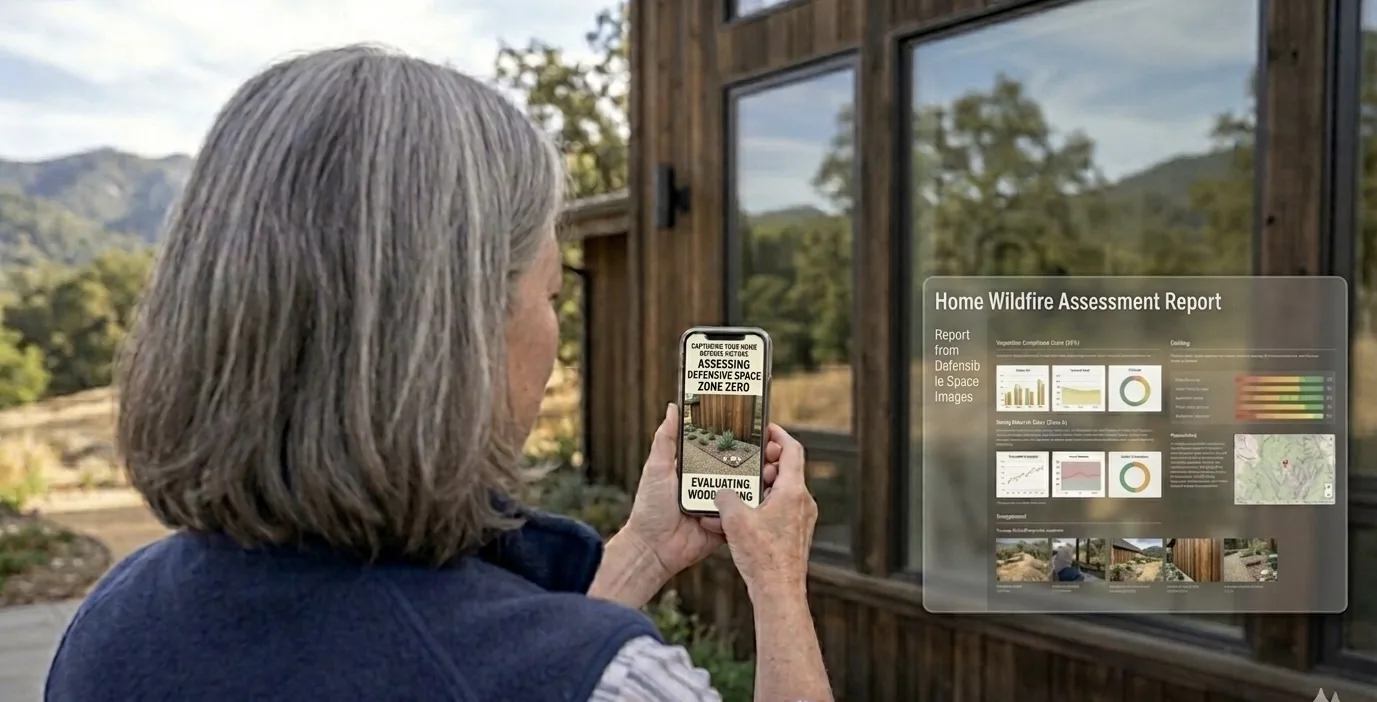
How FireRoofs Helps With Insurance Documentation
We document your property's current conditions, show what upgrades have been completed, and detail how those improvements comply with California wildfire codes. Our home hardening documentation and exterior sprinkler systems are designed to help you build your case across the 12 categories under Regulation 2644.9. We help you document everything so you have what you need when working with your insurer, applying for FAIR Plan discounts, or making the case to return to a standard carrier.
Read more about wildfire insurance in CaliforniaDo Roof Sprinklers Actually Work Against Wildfires? [The Data]
We get this question a lot. The honest answer: sprinklers are not a magic bullet, and we would never tell you they are. No single system protects a home from every fire scenario. But when exterior sprinklers are paired with proper home hardening and maintained defensible space, the survival data is hard to ignore.
survival
Ham Lake Fire, Minnesota (2007)
188 out of 188 homes with exterior sprinklers survived. Zero losses.
survival
Logan Lake, British Columbia (2021)
All 250 homes in the community survived after volunteer crews deployed exterior sprinkler systems during the approach of a major wildfire.
survival
Los Angeles Fires (2025)
59 of 61 homes equipped with exterior sprinklers survived the Palisades and Eaton fires. The two losses were from direct flame exposure, not ember attack.
survival
Camp Fire, Paradise (2018)
Post-fire analysis showed an 87% survival rate for structures with active sprinkler defense, compared to roughly 45% for structures relying on defensible space alone.
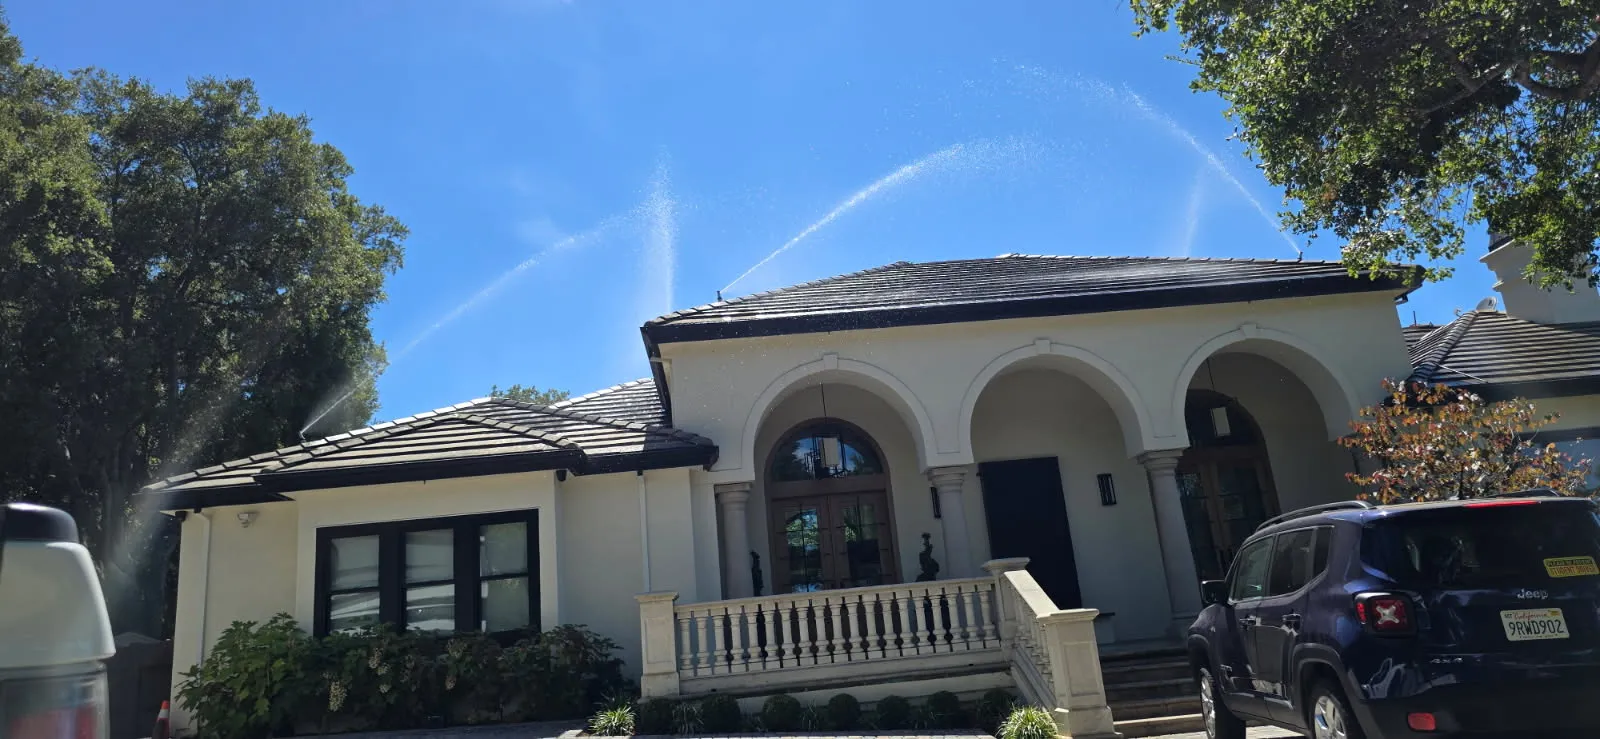
A FireRoofs exterior sprinkler system pre-wetting a roof and the surrounding perimeter. The system activates automatically when conditions are dangerous.
Embers cause the majority of home ignitions during a wildfire. They land on roofs, pile up in gutters, get pushed into attic vents, and settle against siding. A wet surface is dramatically harder to ignite than a dry one. That is the core idea behind exterior sprinkler systems: keep the surfaces wet so embers cannot take hold.
But sprinklers alone are not enough. You also need Class A fire-rated roofing, ember-resistant vents, non-combustible fencing in Zone 0, and well-maintained defensible space. That is why our approach starts with home hardening documentation and pairs it with exterior sprinkler systems. The combination is what makes the difference.
What You Can Do Right Now
Statistics can feel overwhelming. But behind every number is a homeowner who had options, whether they knew it or not. Here is what we tell every client who comes to us.
Proper defensible space: vegetation managed, non-combustible materials near the structure, clear access for emergency crews.
Start with your property
Get a professional assessment of your home. Understand your roof type, vent situation, fencing materials, and vegetation clearances. You cannot fix what you have not measured.
Address the biggest vulnerabilities first
For most homes, that means Zone 0 clearance, replacing combustible fencing within five feet of the structure, and making sure your vents are ember-resistant. These are relatively low-cost changes that make a real difference.
Document everything
California now has a formal framework for wildfire mitigation discounts through Regulation 2644.9. When you document your improvements across the 12 categories, you are building a record that insurers recognize. This matters whether you are trying to get a discount on the FAIR Plan, exit the FAIR Plan entirely, or attract a standard carrier.
Add active defense layers
Once your home hardening and defensible space are solid, an exterior sprinkler system adds the active defense layer that keeps surfaces wet during ember storms. It does not replace the other work. It builds on top of it.
About This Page
This page was written and is maintained by the FireRoofs team. Our founders come from construction and landscaping backgrounds, and we live and work in the same high fire risk areas where our clients live. We are not a national company writing about California from across the country. We drive these hills, walk these properties, and see this risk up close every day.
All statistics on this page are sourced from CAL FIRE incident reports, the National Interagency Fire Center (NIFC), California Department of Insurance filings, and published fire science research. We update this page as new data becomes available. If you spot something that needs correcting, let us know.
Continue Reading
Know Your Risk. Build Your Defense.
Every property is different. Let our team assess your home, document its current condition, and build a plan that addresses your specific vulnerabilities. We start with home hardening documentation and exterior sprinkler systems because that combination is what the data supports.
What Do These Numbers Mean for Your Home?
Statistics tell one story. Your property tells another. Get a satellite pre-assessment showing your specific roof condition, fire zone, and vegetation exposure. Real data for your real address.
- Your fire zone and wildfire probability
- Vegetation and terrain around your home
- Full assessment with California code review available
Takes about a minute. No account needed.